At Teachstone, one of the biggest questions we get about research is, “If we work on educator-child interactions, how much can we expect to improve?” The answer is...well, it depends on what you’re doing, how much of it you’re doing, and how well you’re doing it! A recent evaluation of California’s Comprehensive Approaches to Raising Educational Standards (CARES) Plus program gives us more information to answer this elusive question about outcomes.
With the goal of supporting and retaining early childhood educators while improving their effectiveness, CARES Plus combined basic training on effective classroom interactions with more-intensive professional development components. All participants were required to complete CORE, a set of online training modules using the CLASS lens to examine effective interactions. Then, they chose from several PD options:
- 21 hours of approved, evidence-based training (Component A). 32% of participants chose this option.
- 6 semester hours of higher education toward a degree in early childhood education, child development, or a related field (Component B). 56% of participants selected this option.
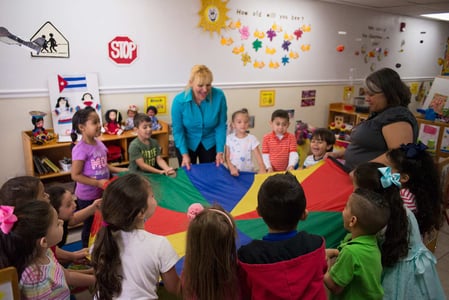
- Participating in MyTeachingPartner (MTP), (now called 1:1 CLASS Video Coaching) intensive, individualized coaching in cycles that last approximately two weeks. During each cycle, teachers record themselves interacting with children and a coach reviews it, providing feedback and prompts to guide their follow-up discussions and teacher’s action plan. (Component D) 9% of participants enrolled in MTP.
From the 2012-13 and 2015-16 school years, nearly 18,000 educators completed CARES Plus. Educators were racially/ethnically diverse, with 50% of participants identifying as Hispanic or Latino, 22% White, 11% Asian, and 9% Black/African-American. Nearly half of participants had less than an Associate’s degree (45%), with about a quarter holding an Associate’s (26%) and 29% with a BA or higher.
The evaluation used a stratified sample of pre-K participants to assess the relationship between each learning experience and improvements in CLASS scores (Component A had 153 teachers, Component B had 153 teachers, and Component D had 851 teachers). Beyond the important implications CLASS scores have for student outcomes, they’re an important part of California’s Tiered Quality Rating and Improvement System (TQRIS), which sets standards for each domain (Emotional Support = 5.0, Classroom Organization = 5.0, and Instructional Support =3.0).
Component A teachers saw a small but statistically significant improvement in their Emotional Support (0.14 standard deviation) and Classroom Organization scores (0.22 SD). By the end of the year, a higher proportion of these teachers met standards in these domains, with an increase from 75% to 89% meeting standards for Emotional Support and from 54% to 84% in Classroom Organization. Component B led to similar improvement in Emotional Support, with 84% of participants meeting the standards by the end of the year.
The most substantial changes were seen for teachers in Component D, MyTeachingPartner. In the MTP group, significantly more teachers met standards at the end of the year than at the beginning in Emotional Support (from 70% to 77%), Classroom Organization (also 70% to 77%), and Instructional Support (20% to 30%). The evaluation also found statistically significant improvements in all three domains, with the largest improvements seen for Instructional Support (0.50 SD). This effectiveness did not significantly vary by years of experience—new teachers and veterans alike demonstrated comparable improvement.
What’s really important, though, is that the biggest changes were seen for teachers who participated in more cycles. Teachers who only participated in 6-10 MTP cycles across the year averaged improvements comparable to those of teachers in Component A. But the more time teachers put into their PD, the larger their outcomes were in the spring, with teachers who went through 16+ cycles showing nearly three times as much growth in Instructional Support as those who only completed 6-10.
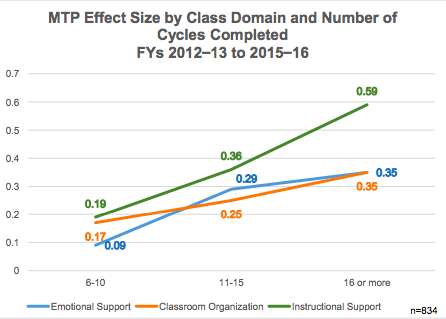
Source: First 5 California
While the data from California don’t exactly answer the question, since they’re embedded in California’s overall culture of CLASS and other contextual factors, they do provide us with a baseline understanding for how different PD opportunities can affect teacher-child interactions. This report also gives us some exciting information about MTP: if you’re able to invest the time, early childhood educators can show pretty substantial improvement.
Citation: First 5 California. 2017. Evaluation of Comprehensive Approaches to Raising Educational Standards (CARES) Plus Program, 2011-2016. Sacramento, CA: First 5 California.