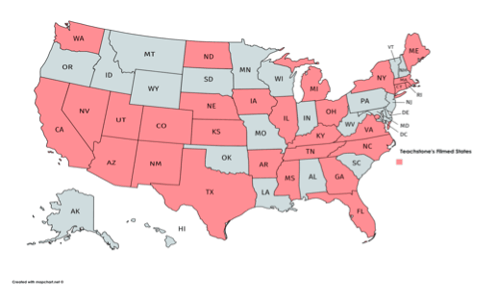
As the Content Asset Manager at Teachstone, I spent most of my time managing our classroom videos. So when I talk to CLASS users in the field, I am frequently asked about the amount of racial, ethnic, and regional diversity in our video collections. When I respond, I usually begin by explaining that creating products that reflect the diversity of classrooms and communities across the country is a core value for Teachstone.
The information below provides a glimpse into video diversity at Teachstone today.
Footage comes from 28 states, Washington DC, and Puerto Rico
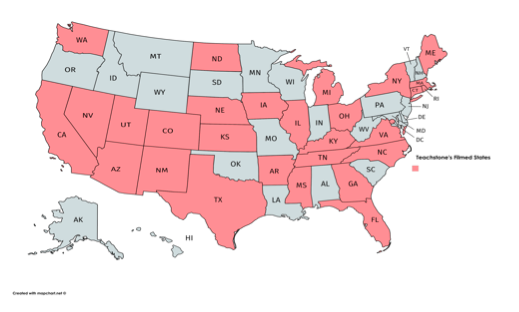
Since Teachstone was founded, we have strived to collect the broadest range of video possible in order to create products that feel realistic and relatable. To help meet this goal, so far we have collected footage in 28 states, the District of Columbia, and Puerto Rico. Across the six CLASS levels, you can see footage from all of the states highlighted in pink below:
Coding Videos Are Fairly Representative of Overall Video Diversity
In order to maximize the diversity of settings on the reliability test, we try to make 3 certification videos from every classroom we film. For that reason, the amount of racial and ethnic diversity in the coding videos on the reliability test for each age level is a good proxy for the amount of racial and ethnic diversity in the footage we have collected for each class level.
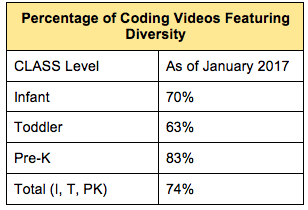
We track several types of video diversity statistics for the Infant, Toddler, and Pre-K reliability tests in order to help us decide which types of programs to film. One metric we look at is the percentage of videos that feature diversity; classrooms are considered diverse if White Non-Latino children do not make up the majority of children in the classroom. As you can see in this chart, a significant majority of our videos meet this standard:
Teacher Diversity Matters
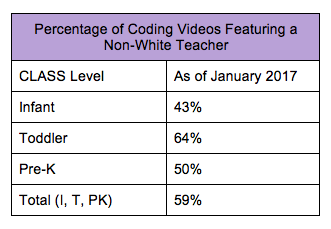
Because it is important for videos to represent a diverse range of teachers, we also track the proportion of coding videos that feature at least one teacher who is not White Non-Latino. While many classrooms we film have multiple teachers who meet these criteria, this chart does not make this distinction. We have more room for growth here, especially for our Infant footage:
We Strive To Keep Footage Realistic
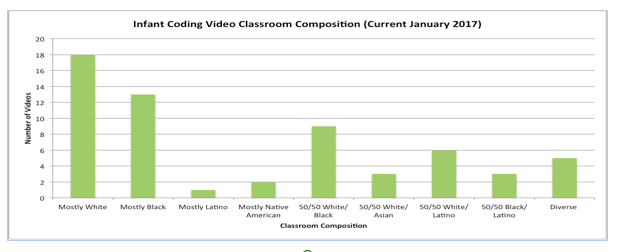
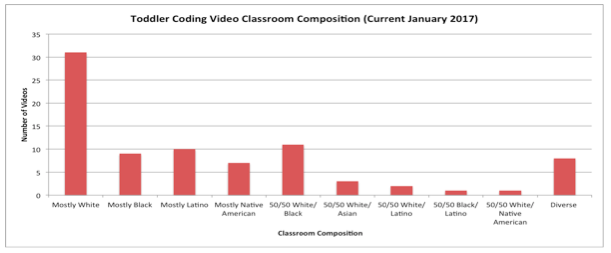
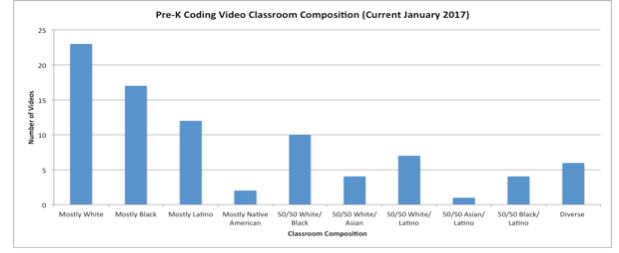
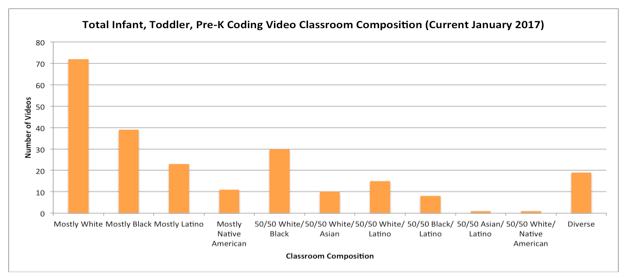
Another thing we track is the overall distribution of classroom compositions. Because we want our products to be as realistic as possible, our ultimate goal is to represent each setting proportionally to how often it occurs in classrooms in the United States rather than to show an equal number of each classroom composition. The charts below show the current distributions for Infant, Toddler, Pre-K, and the three age levels combined.
A quick note on the categories: “Mostly” means there is a significant majority of that demographic group. “50/50” means close to (but not necessarily exactly) half and half. “Diverse” means the classroom contains 3 or more demographic groups of children in near equal proportions.
We Always Have Room For Growth
We are always striving to improve these statistics, and you can help us do better. If you work with classrooms that are currently underrepresented in our footage, we would be delighted to have the opportunity to film your program. Please fill out this form if you are interested in being contacted about potential filming.
Topics: Reliability & Certification, Observation Training, Updates, MMCI & PD

